
PRJ-01

EarningsIQ

Multimodal earnings call analysis — layering vocal stress features over transcript sentiment.

Status
Deployed
Period
2025–2026

Premise

I built this model on the premise that transcript-only analysis discards signal. The linguistic tone of an earnings call has been shown to predict abnormal returns and post-earnings announcement drift, and none of that survives being reduced to text.

Language is easy to optimise. Tone is not. Management can rehearse the words; the delivery is harder to control.

Approach

The system layers FinBERT sentiment over vocal stress features extracted with Wav2Vec2 and Librosa, scoring management confidence against the same timeline as the transcript.

What it produces is a tone-to-text divergence score: the places where the words and the delivery disagree. Alongside that it tracks narrative shifts across quarters and compares a company against its peers.

Role

I was the sole software engineer on a four-person team. I designed the system architecture and wrote most of the implementation; my teammates covered the economics and financial analysis.

Result

The divergence scores correlated with cumulative abnormal returns across the companies tested, and the tool was deployed as a live application.

Presented nationally against 28 university teams: 3rd in the UK in the CFA Institute AI Investment Challenge, with the work published by the CFA Society.
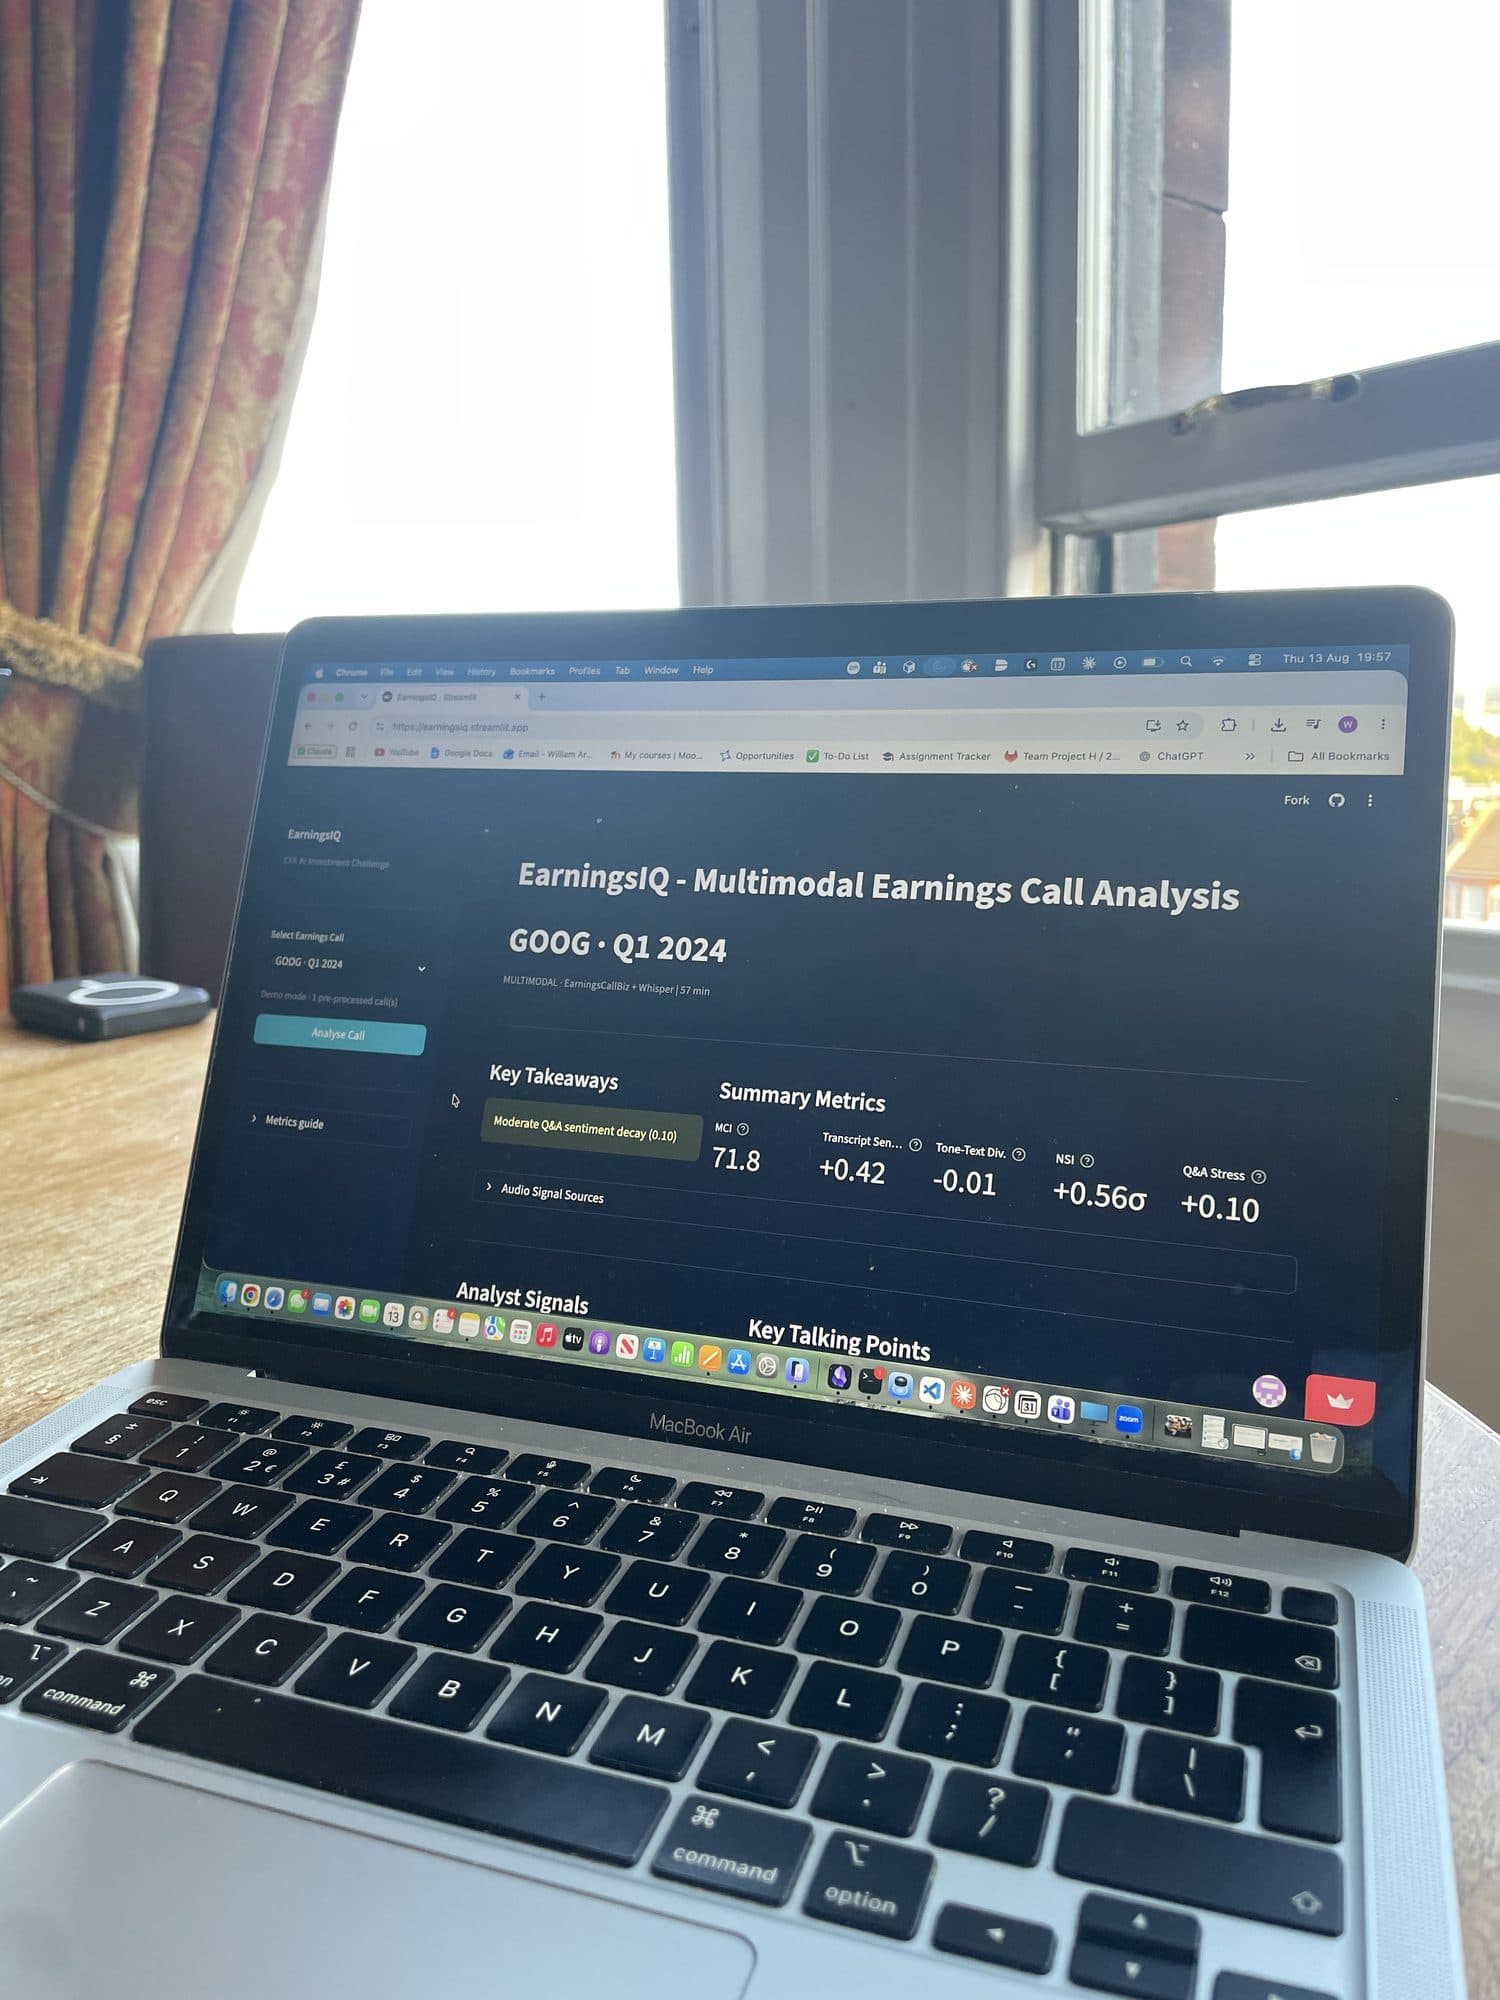
A laptop displaying the EarningsIQ dashboard for Google's Q1 2024 earnings call, showing key takeaways and summary metrics.
Fig. 1 — The deployed tool analysing Alphabet's Q1 2024 call — sentiment, tone-to-text divergence, and Q&A stress side by side.
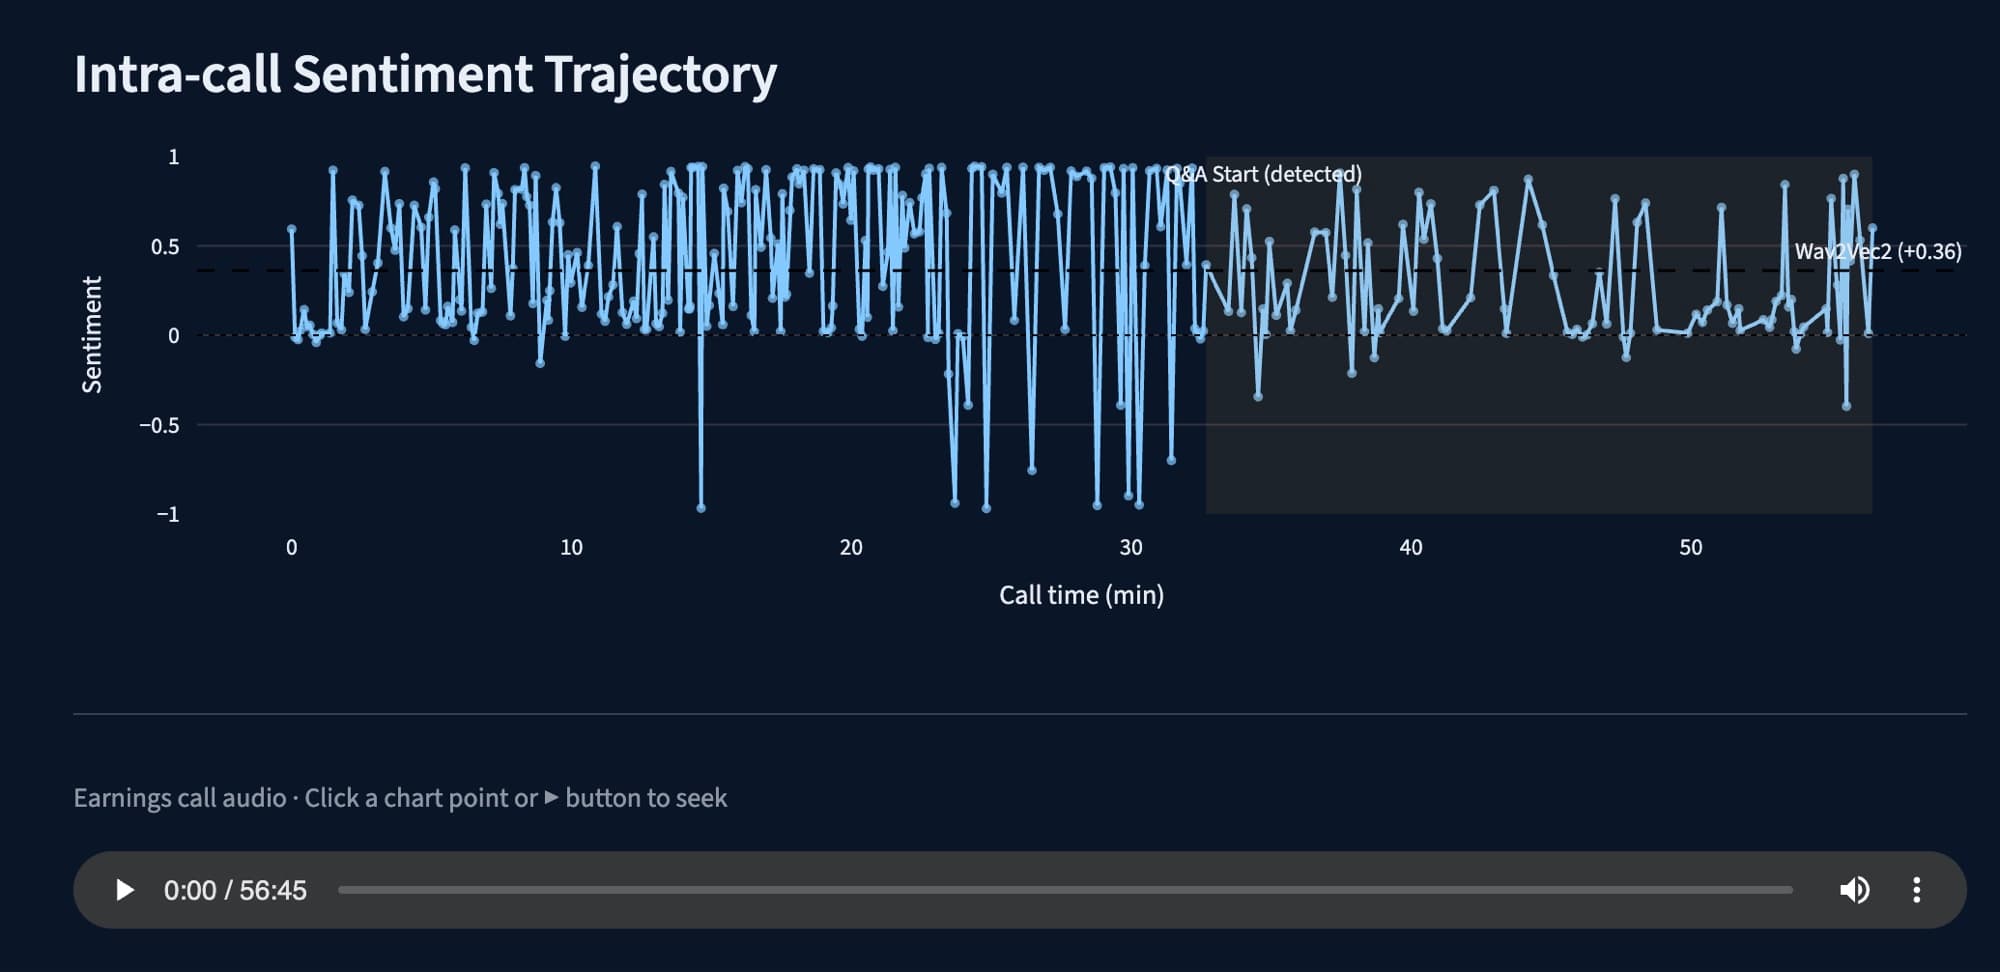
A line chart of sentiment between −1 and 1 across 56 minutes of call time. A shaded region and a labelled marker show where Q&A was detected to begin, a dashed horizontal line marks the Wav2Vec2 score at +0.36, and an audio player sits beneath the chart.
Fig. 2 — Sentiment per utterance across the full call. The Q&A boundary is detected rather than marked by hand, and the Wav2Vec2 acoustic score runs across it as a dashed baseline. Clicking a point seeks the call audio to that moment, so a reading can be checked against what was actually said.
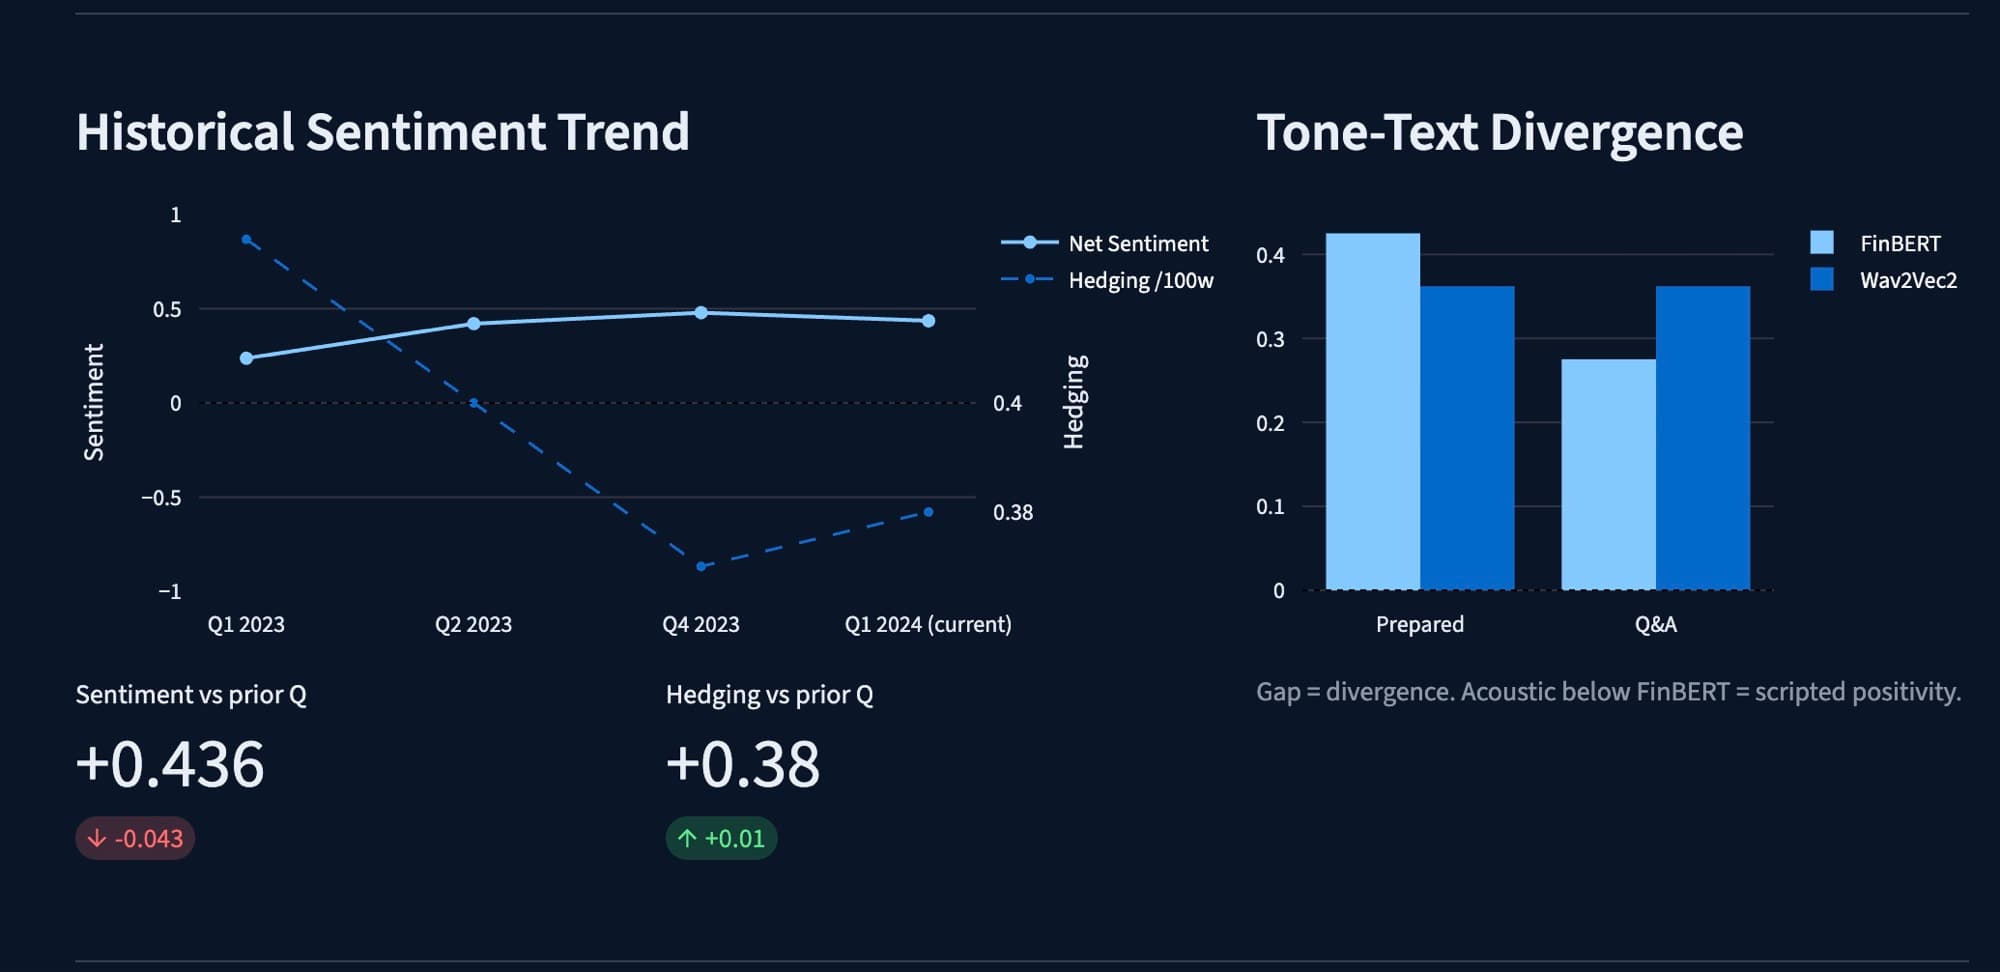
Two panels. Left: net sentiment and hedging per hundred words plotted across four quarters from Q1 2023 to Q1 2024, with figures of +0.436 and +0.38 beneath. Right: paired bars comparing FinBERT and Wav2Vec2 scores for prepared remarks and for Q&A.
Fig. 3 — Narrative tracked across quarters, beside the divergence the tool exists to measure. In prepared remarks the acoustic score sits below FinBERT; in Q&A the two swap over. The gap between the pair, not either bar alone, is the output.
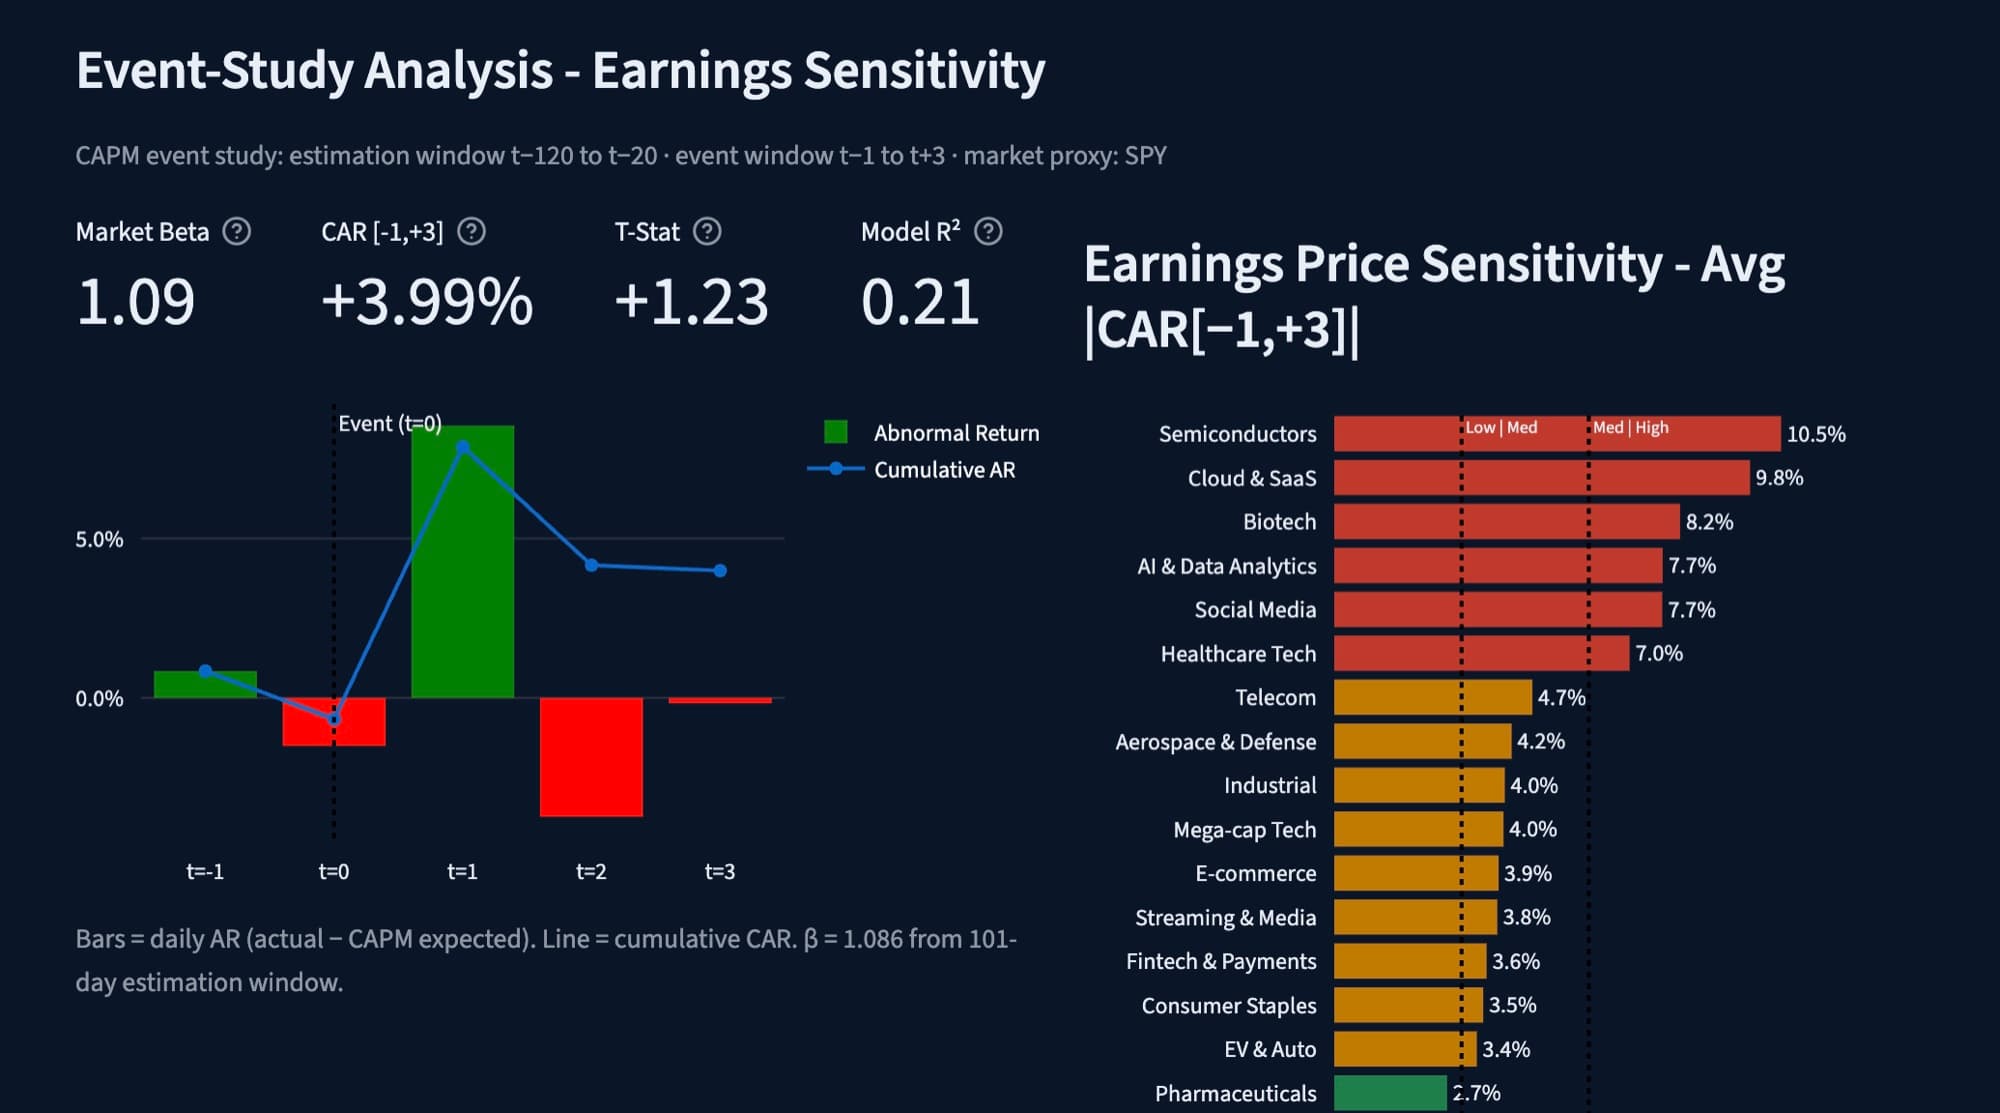
An event-study panel headed with a market beta of 1.09, cumulative abnormal return of +3.99%, t-statistic of +1.23 and model R-squared of 0.21. A bar and line chart plots daily and cumulative abnormal return from t−1 to t+3, beside a ranking of average absolute CAR by sector, from semiconductors at 10.5% down to pharmaceuticals at 2.7%.
Fig. 4 — The CAPM event study the returns are measured against — daily abnormal return over a SPY-based expectation, cumulating across the t−1 to t+3 window, with average earnings sensitivity by sector alongside. The panel reports its own t-statistic of 1.23: one event, short of conventional significance, and shown rather than omitted.